pim-pam.net Geospatial Planning and Budgeting Tools

Local Development Tracker QuickStart

This version: May 23, 2026

This note sets out the motivation, method, and early country applications for the pim-pam.net Geospatial Planning and Budgeting Local Development Tracker tool. The LDT is designed to identify key development and public investment gaps at sub-national levels, illustrated through applications in Nepal, Serbia, and Zambia.

The sub-national challenge

Sub-national governments are vital to realizing frontline development outcomes, including territorial development and job creation. Yet relevant SNG levels, population size, and geographic scale vary substantially across countries.

Statistical and administrative data concerning key development indicators may be missing or outdated. SNGs may also lack local development strategies that best address their challenges and opportunities. Big data from non-traditional and geospatial sources, including satellites, can help address these gaps.

The GPB LDT enables rapid analysis of sub-national development indicators across Prosperity, Livability, and Infrastructure. It deploys a curated list of development indicators, then uses data analytics, visualization, and AI extensions to help users identify patterns, trends, and planning insights.

At the individual SNG level, local development strategies are often the starting point for understanding priorities. These documents are often dispersed, voluminous, uneven in quality, or out of date. The GPB LDT applies systematic AI analytics to assemble as comprehensive a repository of local strategy documents as possible.

The method: two layers, any country

The GPB LDT workflow has two complementary layers. The first builds a sub-national data baseline. The second maps development strategies and translates the evidence into planning and public investment options.

Layer 1

Build the sub-national evidence base

The first layer creates the spatial and statistical foundation for evidence-based analysis.

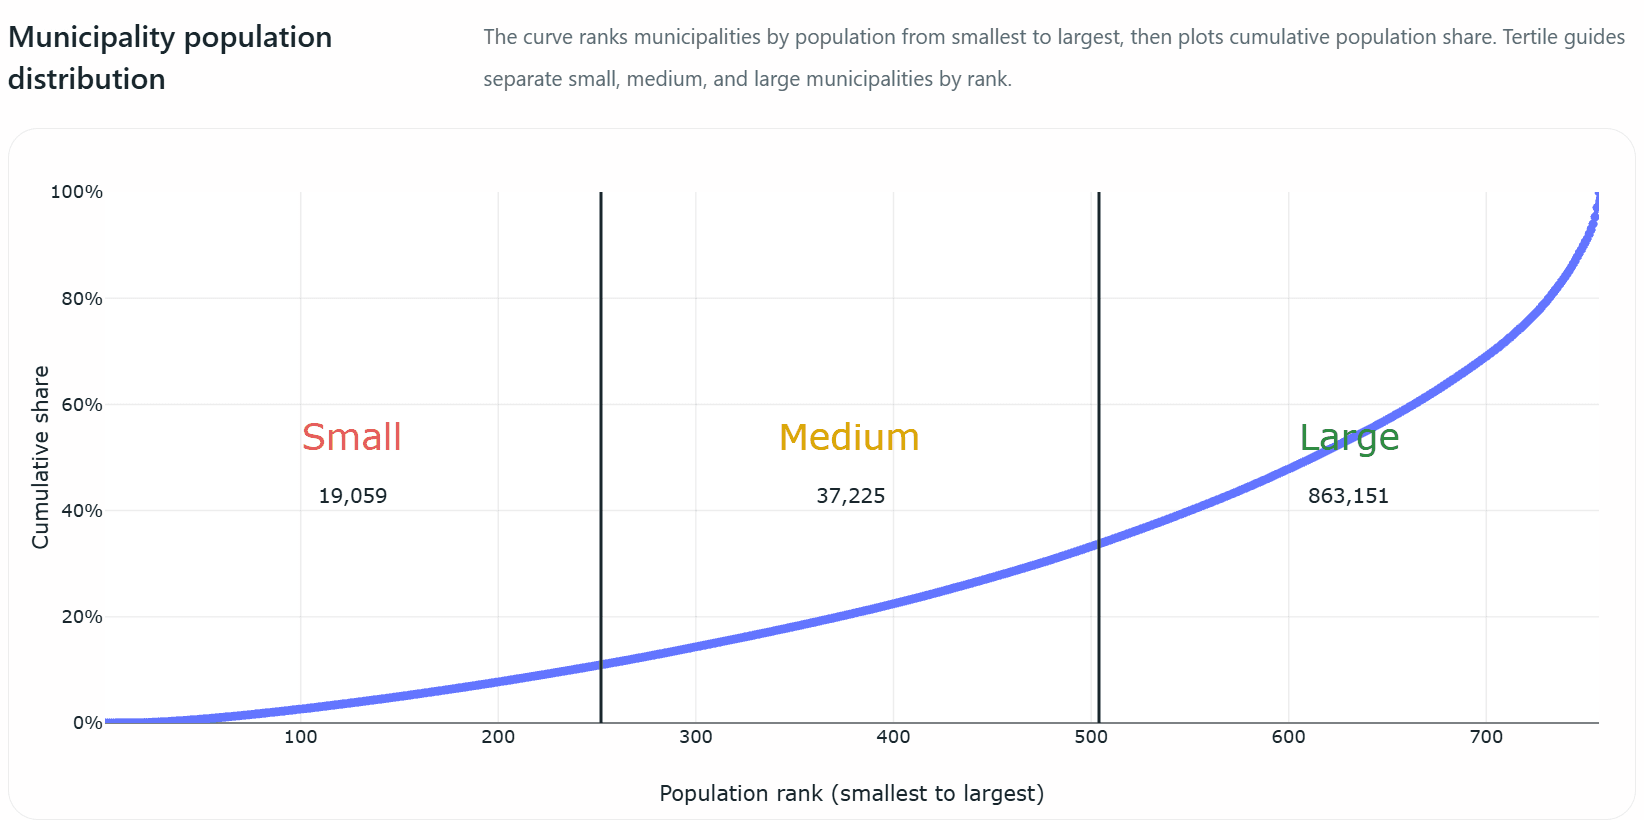
Municipality population distribution chart
Figure. Understand the size distribution of localities.

Step 1 - Define the relevant levels of sub-national government

Two sub-national administrative levels most relevant to the analysis are determined based on their degree of self-governance and discretionary budget control. Regions with partial to full control over budgets are better positioned to plan, invest in, and implement public projects.

Step 2 - Upload the best-available boundary files

Boundaries from official or highly reputable sources are examined for geographical accuracy, administrative consistency, and data vintage. These boundaries form the spatial unit to which indicators, scores, maps, and local analytics are linked.

Step 3 - Generate PIL indicators from global big data

Global geospatial, environmental, infrastructure, and tabular datasets are processed into comparable sub-national indicators for Prosperity, Livability, and Infrastructure. Inputs include VIIRS nighttime lights, WorldPop, GADM, OpenStreetMap, Openrouteservice, Dynamic World, ERA5, WRI Aqueduct, Climate TRACE, and other public datasets.

Step 4 - Validate levels and trends for sample SNGs

Sample municipalities or target SNGs are reviewed for plausible levels, spatial patterns, rankings, outliers, and score drivers. Results are compared with national statistics, administrative records, and local knowledge where available.

Step 5 - Add national statistical and administrative data

Global indicators provide a scalable first-pass view, but country-specific data strengthen interpretation. This may include own-source revenue, migration, employment, demographics, local strategies, national plans, project pipelines, and other planning documents.

Layer 2

Map strategies and translate diagnostics into PIM options

The second layer connects the data baseline and multi-level government development strategies to the planning process.

  1. Step 1

    Build a registry of target local governments with official name, province, district, type, population, area, boundary ID, and available strategy documents.

  2. Step 2

    Analyze PIL scores while identifying strengths and watchpoints across Prosperity, Livability, Infrastructure, and the PIL aggregate.

  3. Step 3

    Identify, consolidate, and assess alignment across national, provincial, sector, donor, and local development strategies.

  4. Step 4

    Use GenAI and reputable web context to produce municipality-level planning narratives, development gaps, likely drivers, peer comparisons, and policy alignment.

  5. Step 5

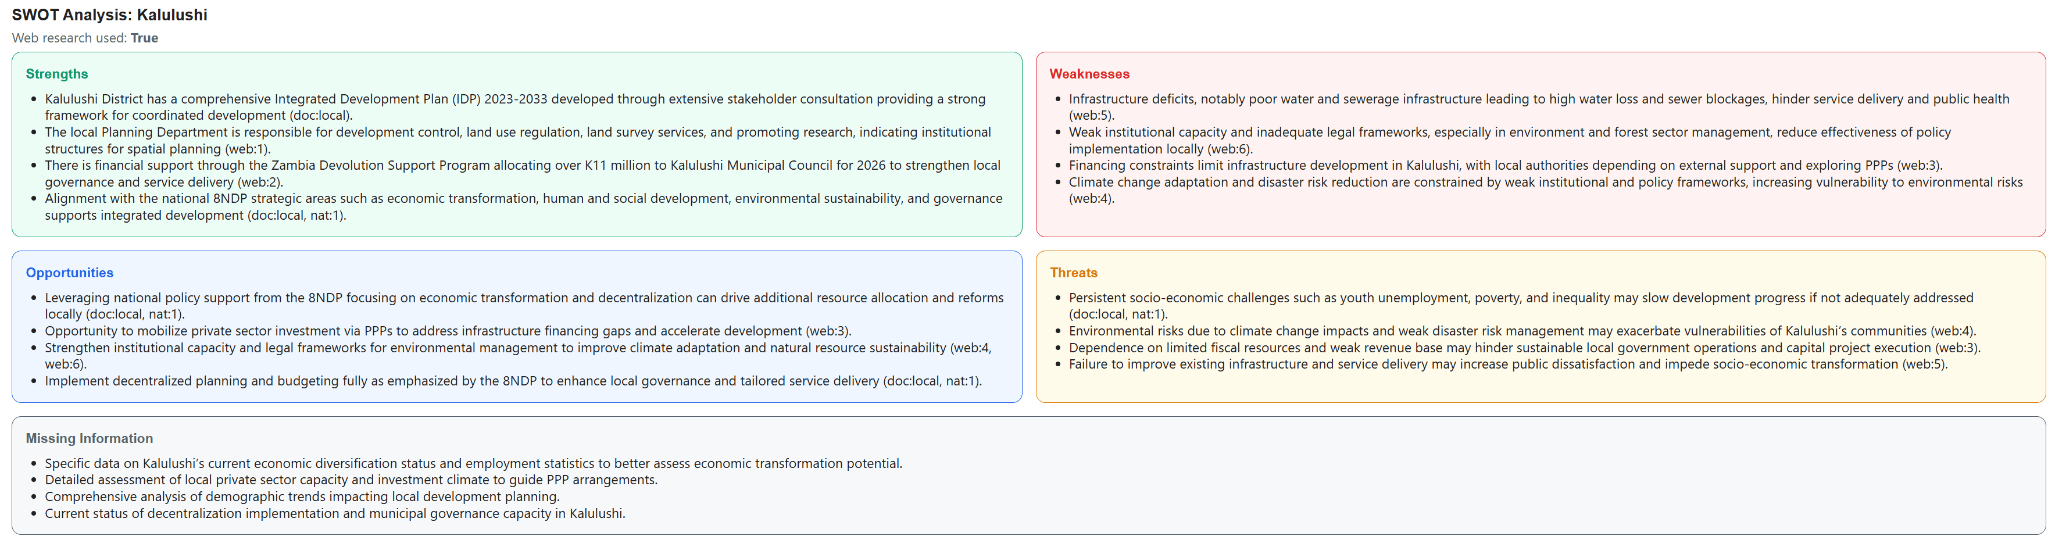
    Generate evidence-backed SWOT analysis for each local government using PIL scores, strategy content, opportunities, and risks.

  6. Step 6

    Translate PIL evidence, strategy alignment, and SWOT outputs into public investment and asset-management recommendations.

Figure 1. Panel of GPB LDT country demo highlights

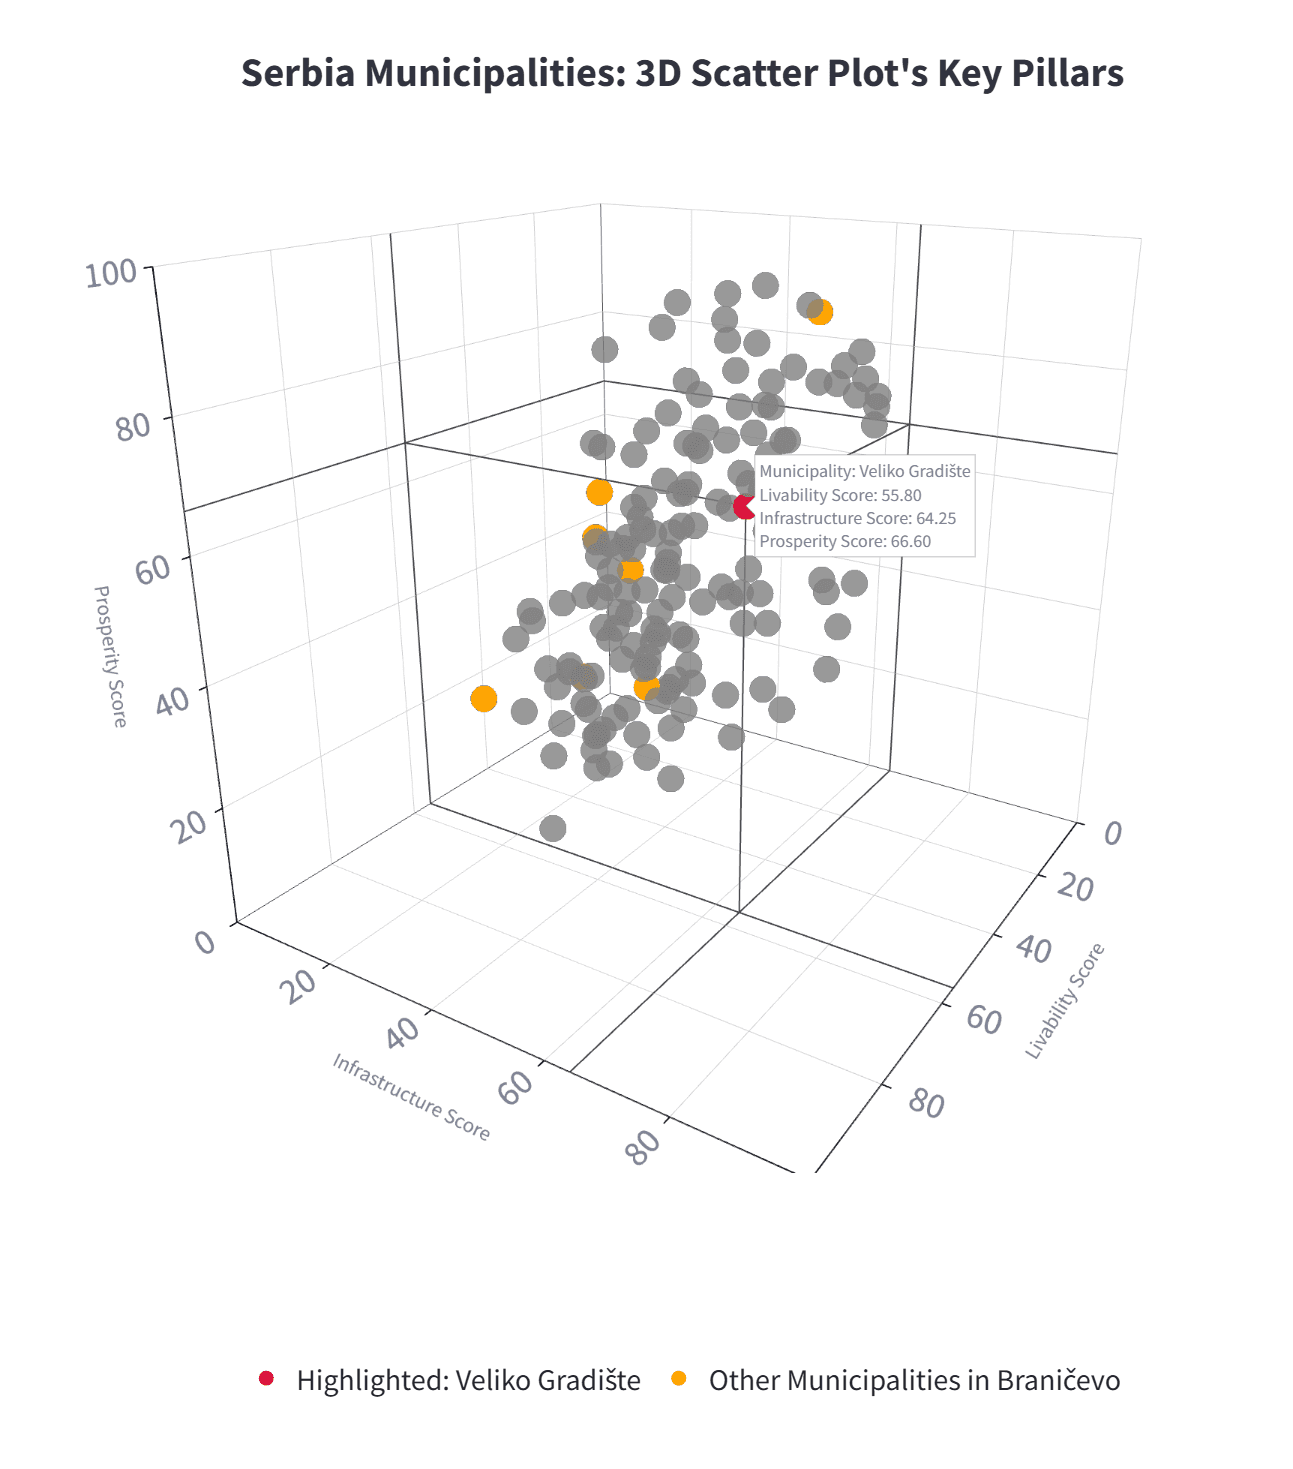
Three-dimensional PIL ranking view for sub-national governments
SNGs can be ranked across three-dimensional Prosperity, Infrastructure, and Livability measures.
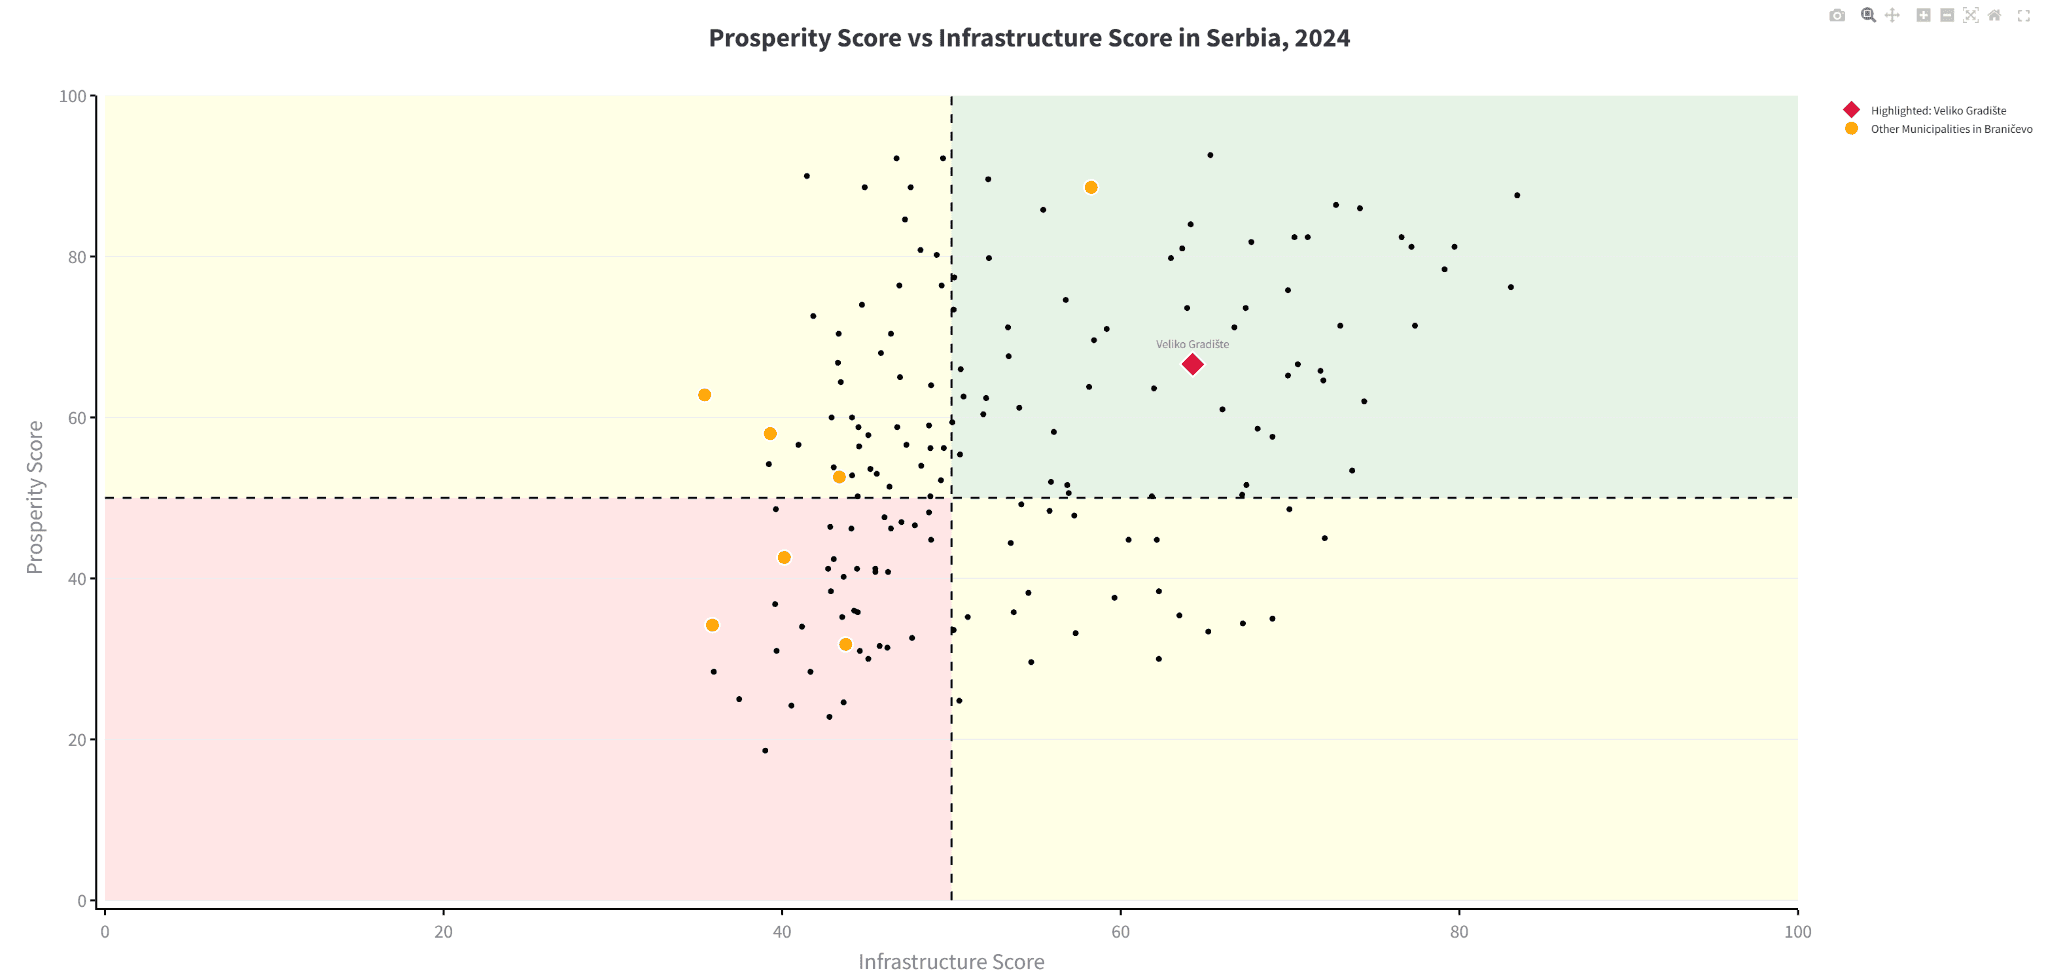
Two-dimensional quadrant analysis for prosperity and livability
Users can use 2D quadrant analysis for further insights, such as identifying high-prosperity and high-livability leaders.
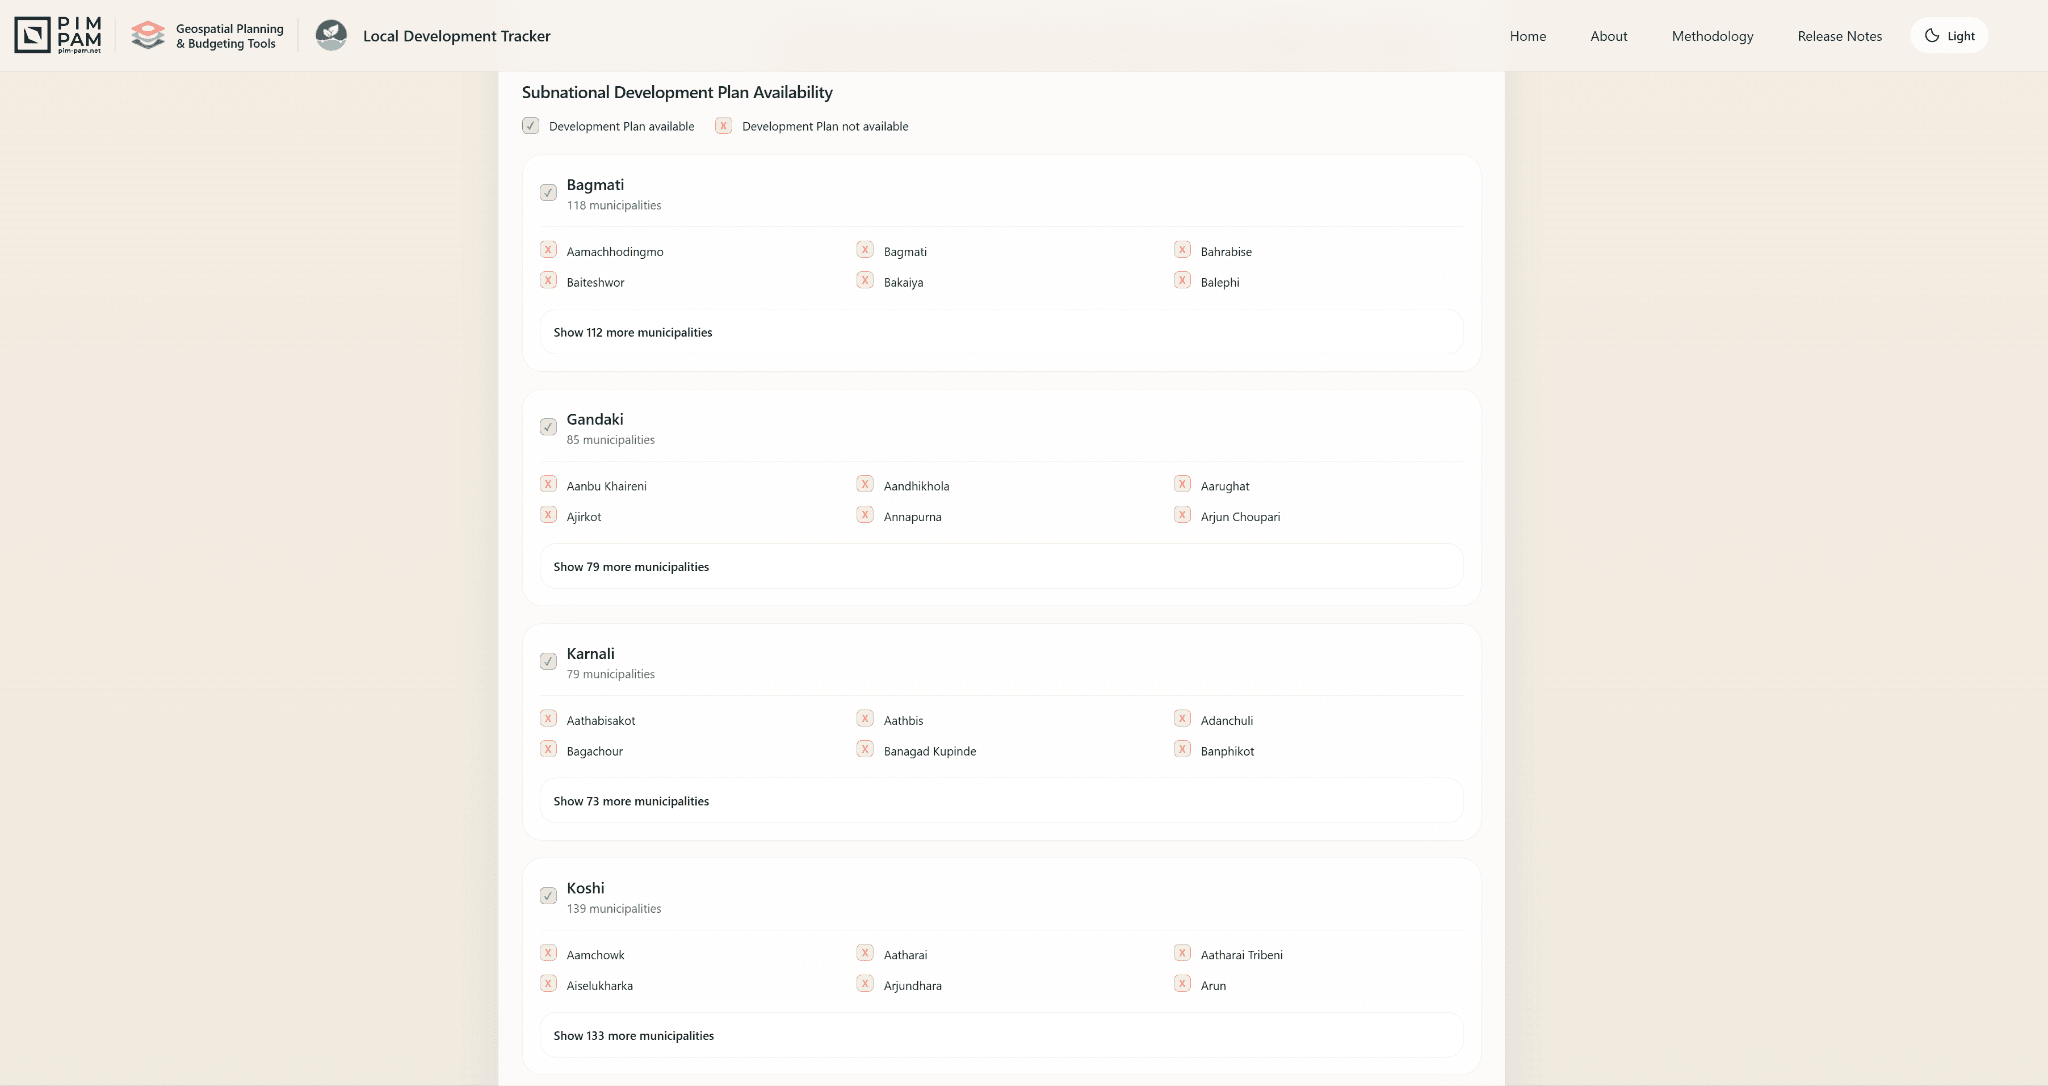
Strategy inventory availability view
The analysis shows where SNG development strategies are available.
Population size distribution view
The tool also maps population size distribution across localities.
AI-powered SWOT analysis panel
AI-powered SWOT analysis brings together insights from PIL scores and development strategy mapping.

Replicability: adding the next country

The LDT has been designed for replication across country settings. The workflow does not depend on one country's administrative system, data architecture, or planning terminology. Country, sub-national level, boundary file, indicator set, population layer, strategy documents, and complementary administrative data are inputs to a common method.

Global geospatial and big-data sources can provide a consistent first-pass baseline for nearly any country and sub-national geography. Country-specific data can then be added where available to improve relevance and interpretation.

The main time driver is not redesigning the method. It is the availability, quality, and validation of country boundaries, local strategies, and complementary administrative data. Once these inputs are assembled, the LDT provides a repeatable structure for turning local evidence into planning insights.

Key limitations and validation needs

The LDT is most useful when its limitations are explicit. It provides a structured starting point for local development diagnostics, not a final judgment on local performance or project priority.

Big-data proxies require validation

Many PIL indicators are based on global geospatial datasets. These sources allow rapid, comparable analysis, but they may not perfectly reflect local conditions. Nighttime lights, accessibility layers, climate models, emissions estimates, and other proxy indicators should be checked against national statistics, administrative records, and local knowledge where available.

Administrative boundaries and SNG definitions matter

Results depend on the sub-national level selected for analysis. District-level diagnostics may hide municipal differences, while municipal-level diagnostics may be too granular for some financing instruments. The chosen geography should match the policy question and the level of government with relevant planning, budgeting, or asset-management responsibility.

Local strategy documents may be missing, outdated, or uneven

The quality of the strategy registry depends on what is publicly available and what counterparts can provide. Where local plans are unavailable, the LDT can still use PIL evidence and higher-level plans, but recommendations should be treated as first-pass planning inputs rather than substitutes for local strategy preparation.

AI outputs need human review and source transparency

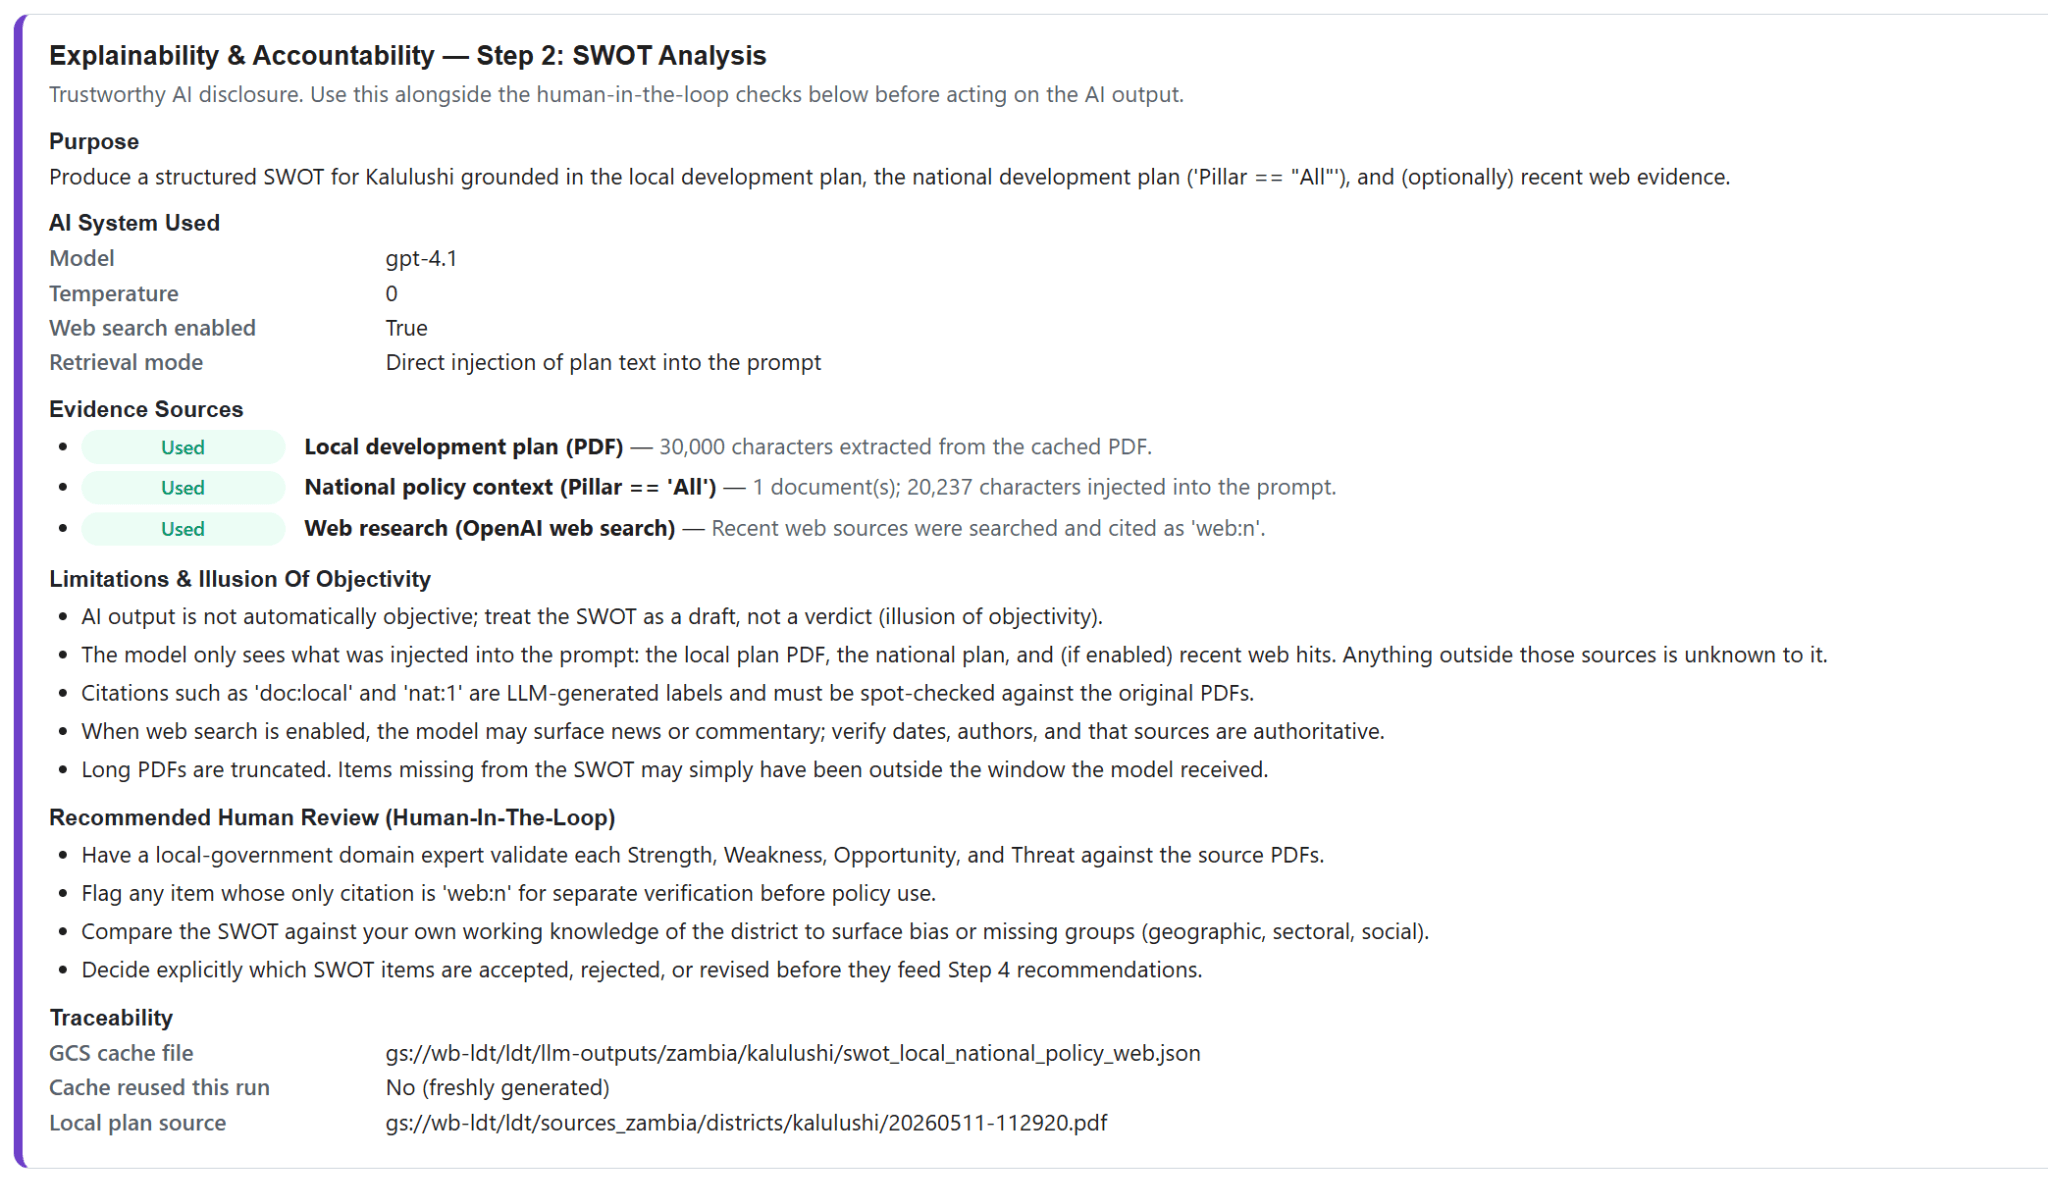
AI-generated narratives, SWOTs, and investment recommendations should be inspectable. Users should be able to see which indicators, strategy documents, and source materials support each output. AI can accelerate synthesis, but sector teams, country teams, and local counterparts should review outputs before they inform policy dialogue or project pipelines.

PIL scores do not capture every implementation constraint

A low infrastructure or livability score may indicate a priority issue, but it does not establish project feasibility, fiscal affordability, readiness, procurement capacity, land availability, or operation and maintenance sustainability. The LDT should feed into public investment management processes where concepts can be screened, appraised, selected, and sequenced.

The central principle is simple: use the LDT to make local development patterns visible, then validate, contextualize, and translate those patterns through the country's planning and PIM systems.

Selected country findings

The three country applications below illustrate how the same method adapts to different planning contexts: filling local evidence gaps where strategies are missing, moving from diagnostics to investment-ready project matching, and focusing on a specific class of localities such as mining districts.

CountryLevel of focus# SNGs (Level 1)# SNGs (Level 2)% with strategiesFocus topic
NepalMunicipalities7 provinces7530*Two municipalities from each of Madhesh, Karnali, and Sudurpashchim provinces
SerbiaMunicipalities29 districts161 Local Self Governments (LSGs)**~94%***LIID Early Investors
ZambiaDistricts10 provinces116~97%Mining Districts

* Provincial strategies are available.

** For Serbia, 174 if Kosovo is included.

*** For Serbia, the 94% figure does not include Kosovo.

Nepal: filling local planning evidence gaps

Nepal is a strong test case because the binding constraint is not the absence of local authority, but the absence of consistently available local planning evidence.

Municipal development plans are not systematically available or disclosed. The LDT can use PIL diagnostics, provincial strategies, and Nepal's Sixteenth Plan as higher-level policy anchors to generate first-pass local development narratives and investment recommendations.

Serbia: moving from diagnostics to investment readiness

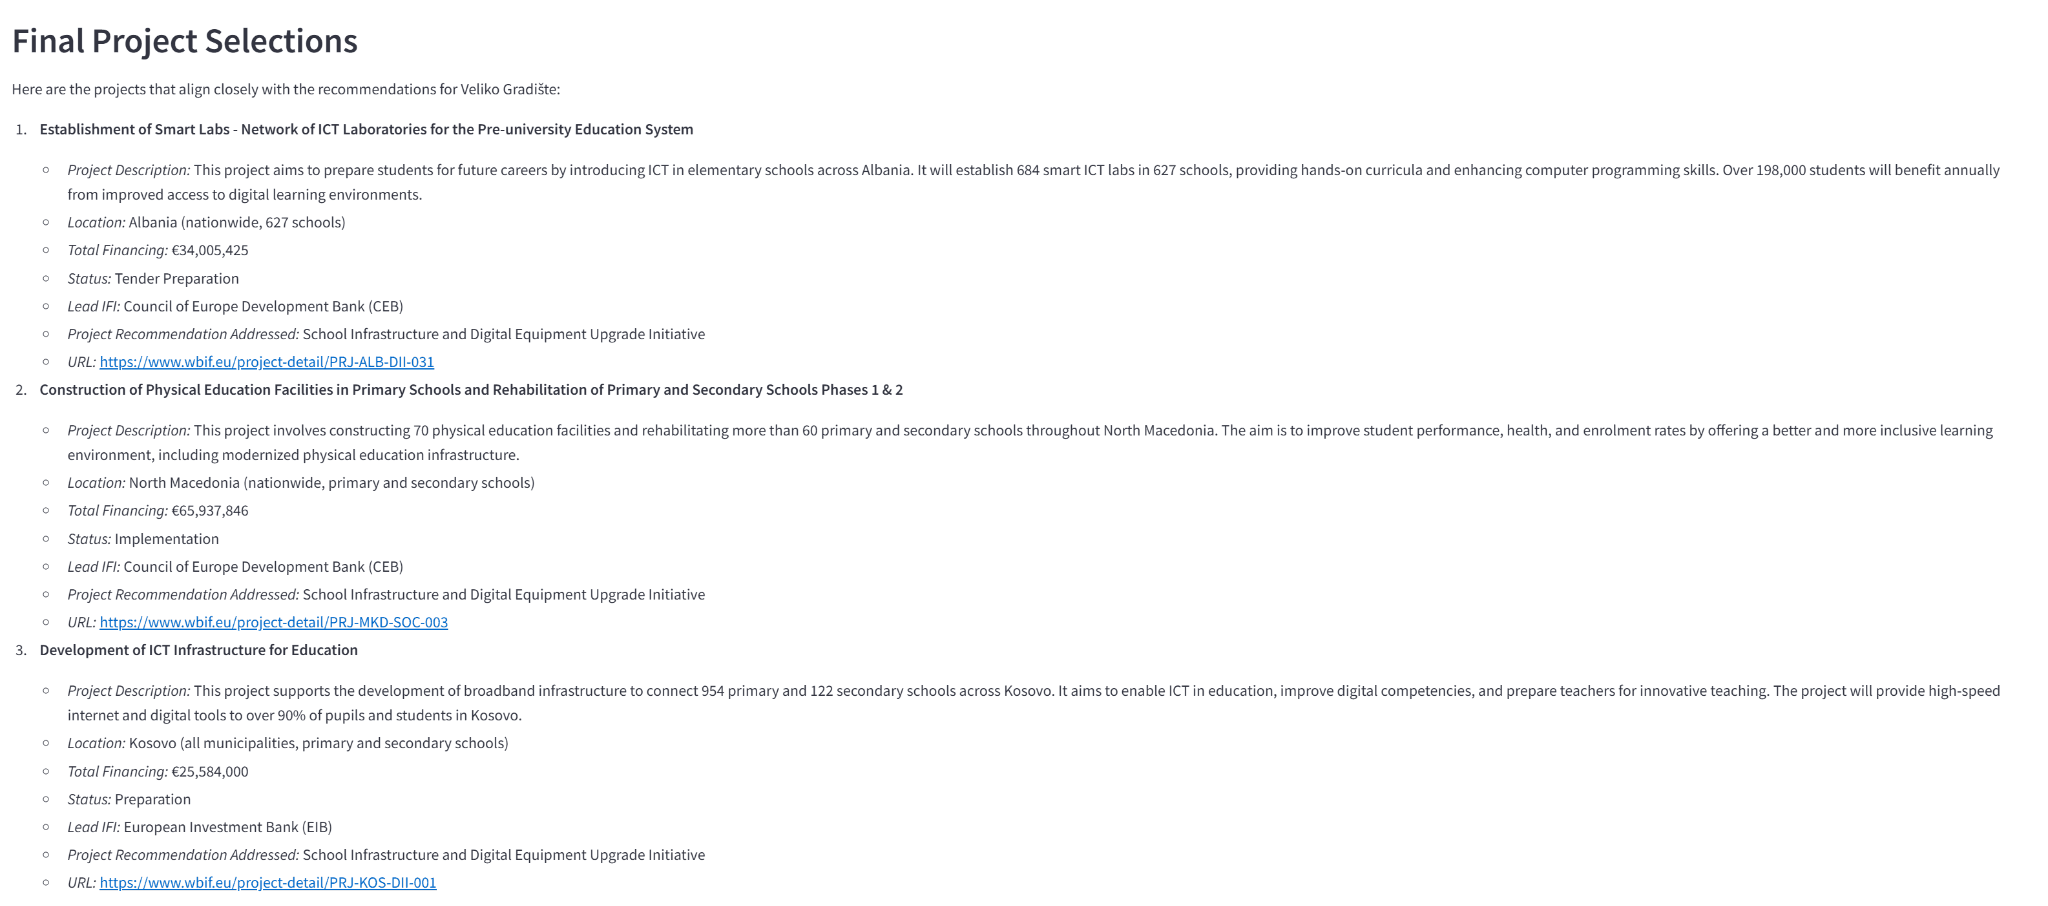
Serbia demonstrates how the LDT can move beyond local diagnostics to investment-ready project matching, supporting efforts around a national ePIM system and the LIID program.

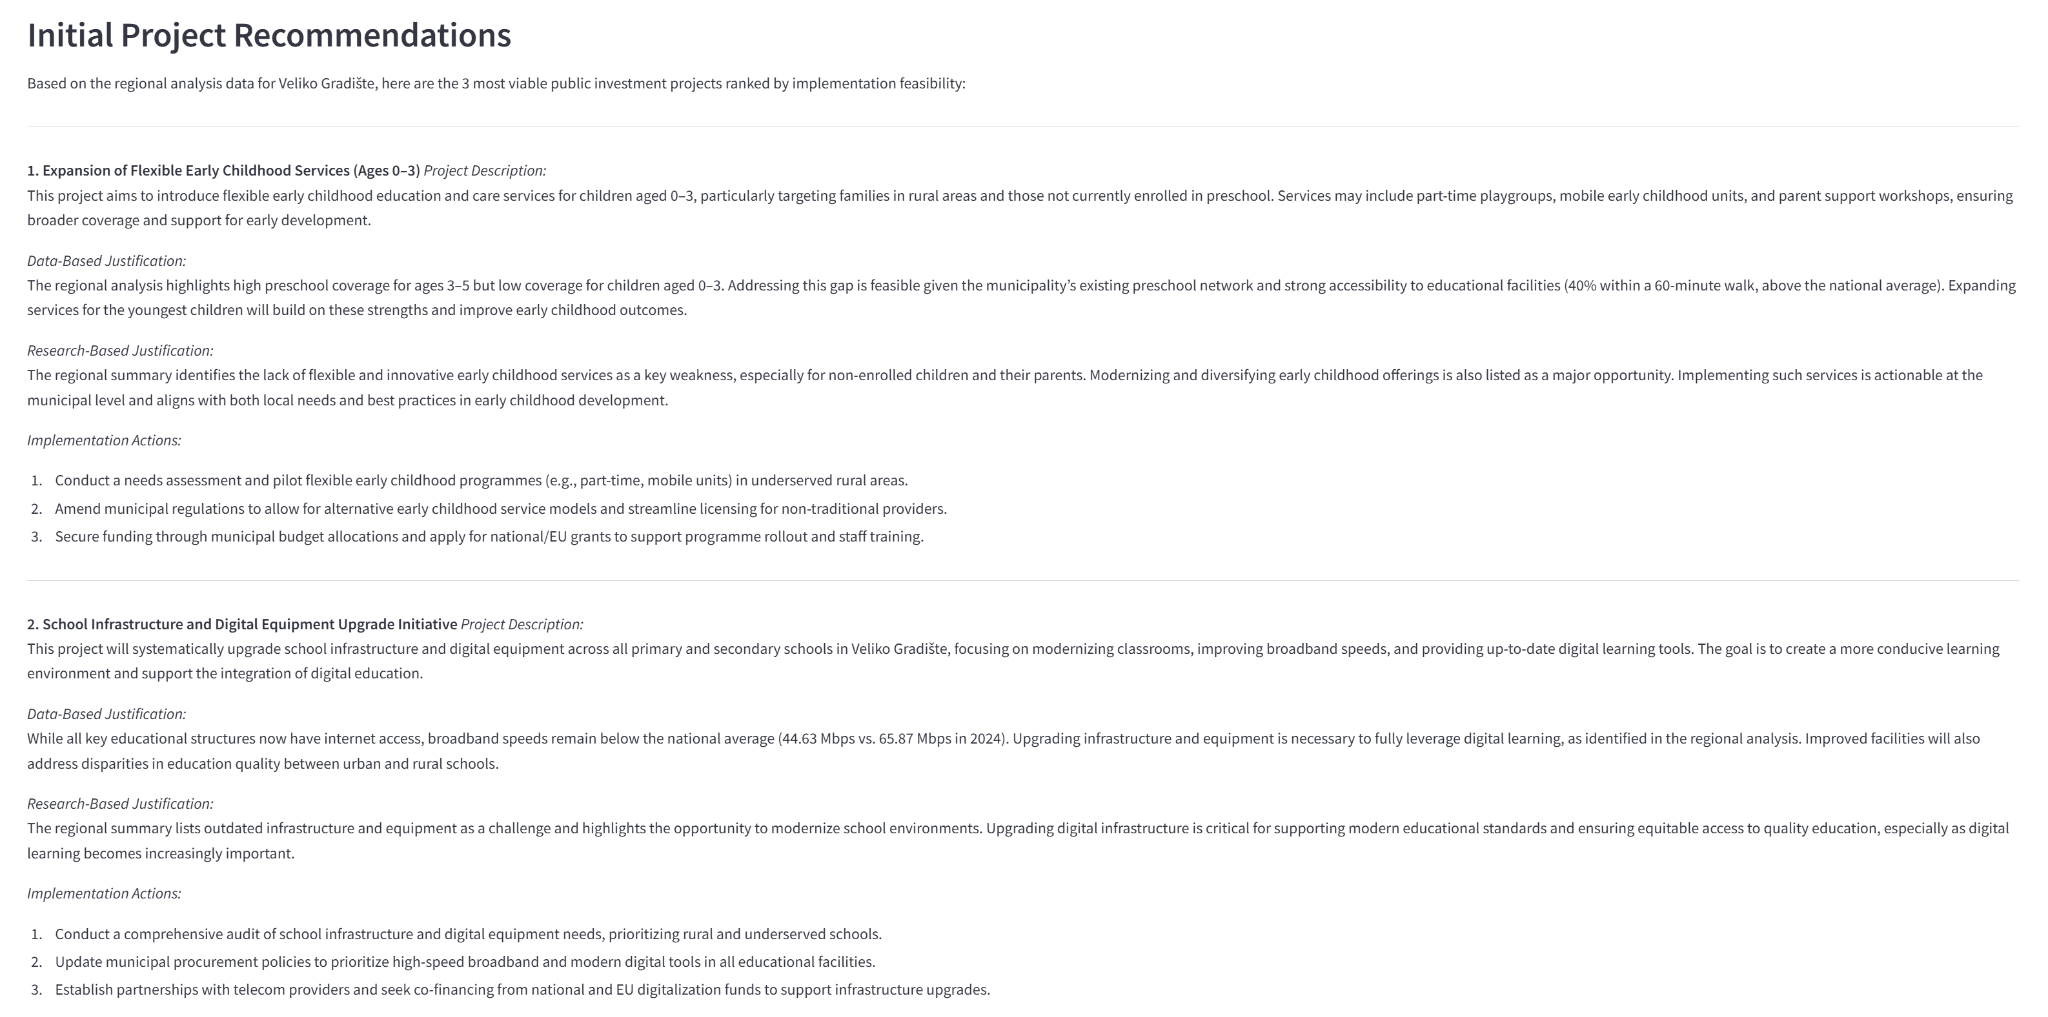
The Veliko Gradiste example moves from school-access and digital-readiness evidence to recommendations on early childhood services, school infrastructure, digital equipment, and dual education linked to local labour-market needs.

Zambia: local development, mining districts, and the 9th NDP

Zambia illustrates how the LDT can support spatial dimensions of the 9th National Development Plan and specific development challenges in mining districts.

Mining districts are an important test case for linking local economic development, PIM, environmental risk, fiscal benefit-sharing, ESG risk, infrastructure, and public financial management.

AI-powered project recommendations screenshot
Figure 3. AI-powered project recommendations combining PIL indicators, relevant web search, and multi-level development plans.
Curated existing projects in Serbia screenshot
Figure 4. Curated existing projects in Serbia to serve as the basis for initial project planning.

Further resources and contacts

Country teams interested in applying these approaches may schedule a 3-4 hour GPB LDT Masterclass, apply the tools in their country context, or request a tailored briefing on related Infrastructure Governance 2.0 diagnostics and other pim-pam.net digital tools.

Contact the World Bank Global PIM-PAM Solutions Team: Kai-Alexander Kaiser, Hyunseok Kim, Fabienne Mroczka, and Kaushiki Singh.

The team thanks the global partners of the World Bank Financial Management Umbrella Program and the Japan Quality of Infrastructure Investment Partnership program for supporting this work.

Selected references

  • Kaiser, Kai-Alexander, Kim, Hyunseok, Mroczka, Fabienne, & Singh, Kaushiki. (2026). Public Finance Review Fundamentals: Enhancing Public Investment Development Outcomes. Washington, DC: Global Governance Practice, forthcoming.
  • World Bank. (2025a). pim-pam.net Digital Decision Support Resources: Workplan 2026. Washington, DC: Prosperity Vertical Governance Department Public Infrastructure Investment and Asset Governance Community of Practice.
  • World Bank. (2025b). pim-pam.net Geospatial Planning and Budgeting Platform Country Data Cube Data Catalogue. Washington, DC & Vienna, Austria: Prosperity Vertical Governance Department Public Finance and Procurement Unit.